How to Dynamically Display Pivot Table Data as Chart.
This article contains information on joint use of OLAP ModelKit and Chart ModelKit. We will create a simple
application that will help you understand how to visually represent data from pivot tables.
First of all we need to define data that will be used. A small database is created in Access (named work.mdb).
Database schema is displayed in the image below.
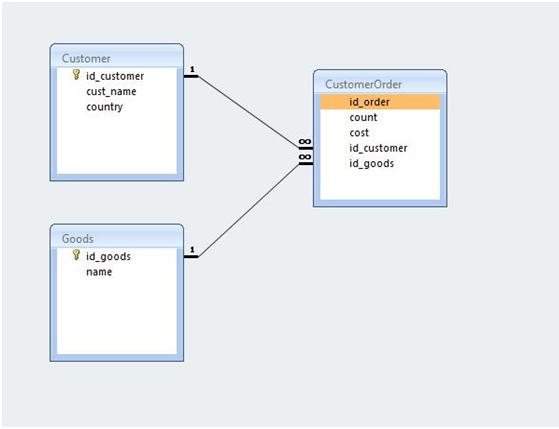
Figure 1: Database Schema
There are three tables: goods (Goods), customers (Customer), and orders (CustomerOrder). All keys are of int32 type;
the rest of fields except of Count and Cost are strings.
We will create a pivot table that will display sum spent for every type of goods by each order. Then we will create
a chart based on this pivot table.
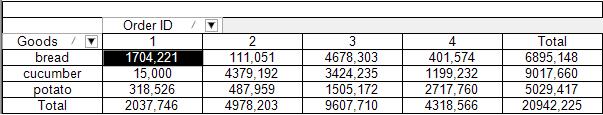
Figure 2: Pivot Table
Let’s create application.
First of all we need to think about structures that will be used as data sources. DataSet will be used for this
purpose. Create a table (CustomerOrder) in the DataSet. A list of its fields is displayed in the picture below.
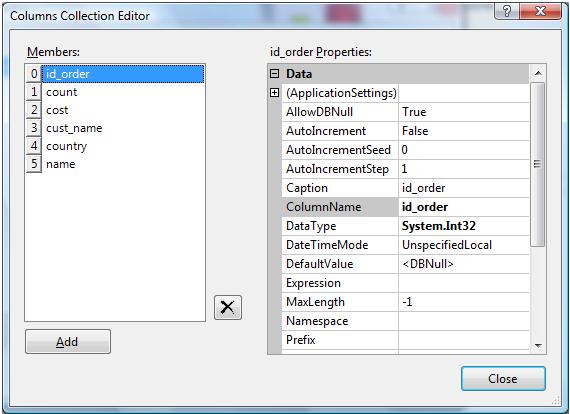
Figure 3: Table fields list
Cust_name, country and name fields are strings, count and cost are of Double type, and id_order is of int32 type.
It is necessary to fill the DataSet in the OnLoad event using our database. Let’s write the following code:
private void Form1_Load(object sender, EventArgs e)
{
OleDbConnection Connection = new
OleDbConnection("Provider=Microsoft.Jet.OLEDB.4.0;Data Source=\"..\\..\\Work.mdb\"");
OleDbDataAdapter adapter2 = new OleDbDataAdapter("SELECT id_order, count, cost, cust_name, country, name FROM
(CustomerOrder INNER JOIN Customer ON CustomerOrder.id_customer = Customer.id_customer) INNER JOIN goods on
CustomerOrder.id_goods = Goods.id_goods", Connection);
adapter2.Fill(customerOrder);
Connection.Close();
}
DataSet is ready for use. Let’s add BindingSource and specify the created DatSet as a data source. Don’t forget to
select the CustomerOrder table as DatMember property value.
Add two components onto the form: DataCube and DataCubeGrid.
Set the created BindingSource as a datasource for DataCube (the DataSource property) and specify the following
parameters for creating a pivot table:
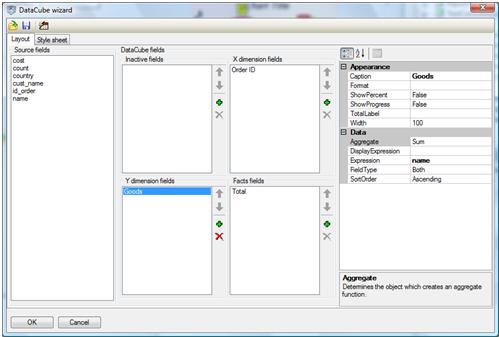
Figure 4: Y Dimension Options
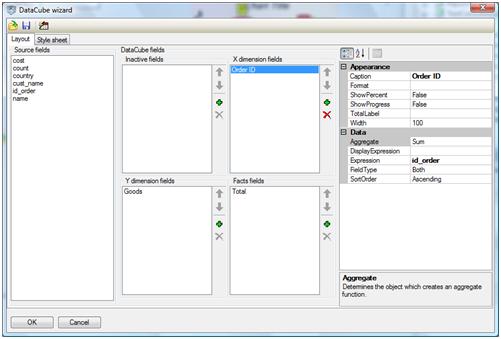
Figure 5: X Dimension Options
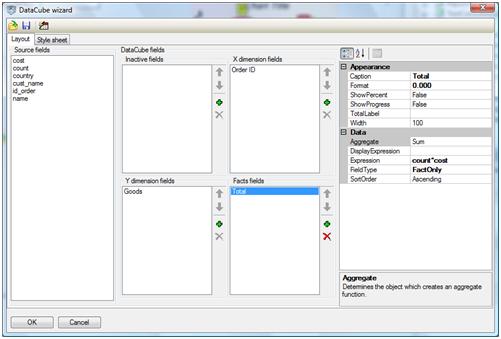
Figure 6: Fact Fields
Set this DataCube as the DataCubeGrid.Source property value.
Thus, we get pivot table. Its columns contain orders ID and rows contain description of goods. The crosses contain
sum by order for the given goods.
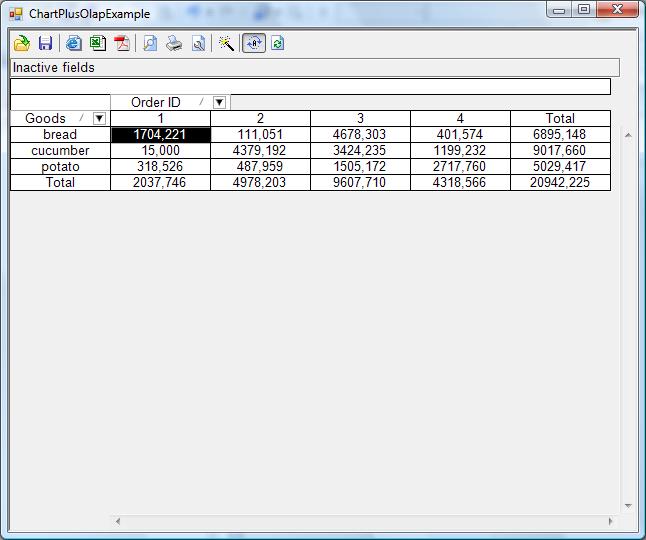
Figure 7: Created Pivot Table
We need to create a chart based on this table and which X axis enumerates order ID and Y axis displays sum by order.
We need to do it so that filtering total data by columns and rows makes chart regenerate.
Step1: Add the DataCubeView component onto the form. Set a DataCube from which the data will be taken (the DataCube
property) and DataCube axis that will contain argument (the PrimaryDimension property). In this case order ID is
located on the X axis, that is why PrimaryDimension is set to X.
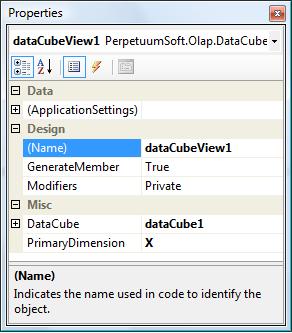
Figure 8: DataCubeView Properties
Step 2: Add the ChartViewer component and add the created DataCubeView in the list of its data sources. It is done
as if we work with with the common DataSet.
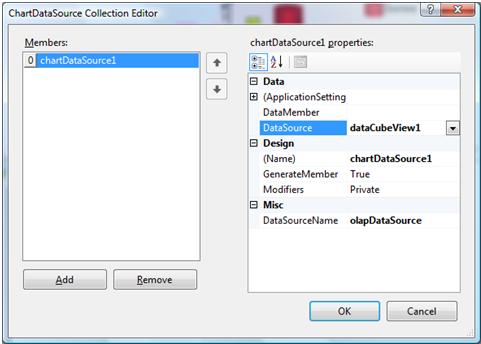
Figure 9: Chart Data Sources Collection
Step 3: Create a chart using the necessary template or from scratch and proceed to editing Series DataSource. Select
a source for chart.
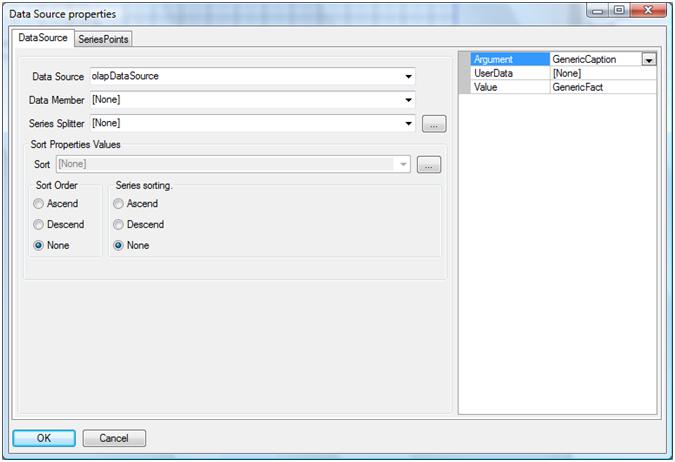
Figure 10: Chart Data Source Properties
Now we need to set the Argument and Value properties. There are two variants. In the first variant it is possible to
set GenericCaption as argument and GenericFact as Value. GenericCaption is taken from the axis specified in the
DataCubeView and GenericFact is total value by this GenericCaption. In this case GenericCaption is id_order and
GenericFact is sum by the order with id_order ID.
Note: You can set field names as argument and value, thouth if you modify X-Dimension, Y-Dimension or Fact values,
you will need to modify chart as well. This is not very convenient, that is why we strongly advise you to use
GenericCaption and GenericFact.
Now we only need to add text to the handler of the change event of the DataCubeView (the ListChanged event). This
event performs when the pivot table is recalculated including tha case of filtering data. So, by writing in it text
to refresh chart we will be able to regenerate chart every time data in the table is changed. Moreover, it is
necessary to set method for recalculating DataCube when the application is launched. Add it to the OnLoad form
handler.
Thus, we get its final variant.
private void Form1_Load(object sender, EventArgs e)
{
OleDbConnection Connection = new
OleDbConnection("Provider=Microsoft.Jet.OLEDB.4.0;Data
Source=\"..\\..\\Work.mdb\"");
OleDbDataAdapter adapter2 = new OleDbDataAdapter("SELECT id_order, count, cost,
cust_name, country, name FROM (CustomerOrder INNER JOIN Customer ON
CustomerOrder.id_customer = Customer.id_customer) INNER JOIN goods on
CustomerOrder.id_goods = Goods.id_goods", Connection);
adapter2.Fill(customerOrder);
Connection.Close();
dataCube1.Recalculate();
}
Here is a sample code for DataCubeView refresh handler.
delegate void DataChangedDelegate();
private void dataCubeView1_ListChanged(object sender, ListChangedEventArgs e)
{
DataChangedDelegate dataChangedDelegate = chartViewer1.Chart.DataChanged;
chartViewer1.BeginInvoke(dataChangedDelegate);
}
The use of BeingInvoke method is reasonable because DataCubeGrid data recalculation is performed in the asynchronous
mode (the CalculationMode property). If you don’t need to calculate data in this mode, you can use the following
code:
private void dataCubeView1_ListChanged(object sender, ListChangedEventArgs e)