|
Professional Reports for Windows Forms Applications
SharpShooter Reports.Win is the powerful .NET
report component that will easily add reporting features to the Windows Forms apps.
Create elegant and visually appealing reports in the intuitive report designer and
deliver reports to your end users in the desktop report viewer or provide them in a
document format (PDF, Excel, RTF, HTML, XPS, etc.) for further exploration and analysis.
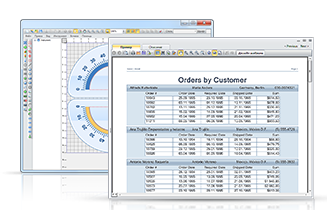
Powerful Reporting
SharpShooter Reports features a rich set of tools to create even
the most sophisticated reports with less time and effort. You can
design simple, multicolumn, side-by-side, hierarchical, pivot table,
sub-report reports and many others. Easy data visualization with
built-in charts, gauges and images provides high performance
analytical abilities.End user designer is provided.
|
|
|
|
Comprehensive Data Analysis
SharpShooter OLAP helps developers build powerful pivot tables
to let users explore and analyze data infinitely. Data in pivot tables
can be easily grouped, filtered, sliced, drilled down and rolled up,
aggregated, ranked and pivoted. Interactive charting of pivot table
data (with any third party charting tool) makes the component
perfect solution for corporate information analysis.
|
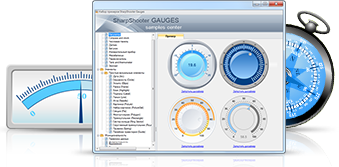
Unrivalled Data Visualization
SharpShooter Charts and SharpShooter Gauges offer complete
tools to design ultimate charts and gauges. You can create rich
data visualizations from scratch or get pre-built gauges or charts.
The following chart types are provided: Bar, Line, Spline, Area, Pie,
Bubble, Candle Stick, Stock and others, all together 180+ charts.
Gauge library includes Meters, Dials, Sliders, Switches, Digital
numbers and text, and other circular and linear controls, all
together over 180 gauges. End user designers of charts and
gauges are available.
|
|
All software components are completely compatible with each other, so you can focus on the application essentials instead of trying to
adjust components to each other.
It is possible to use products in different combinations:
|