Bar chart is represented by the following classes: BarSeriesView, StackedBarSeriesView, and Stacked100BarSeriesView. The SeriesValue class is used as data type.
BarSeriesView is a bar chart, where bars, corresponding to different series values, are located side by side.
StackedBarSeriesView is a bar chart, where bars, corresponding to different series and a single argument, are located one over another.
Stacked100BarSeriesView is a bar chart, where bars, corresponding to different series and a single argument, are located one over another, but they demonstrate relative value from the total amount of the given series type values at the given point.
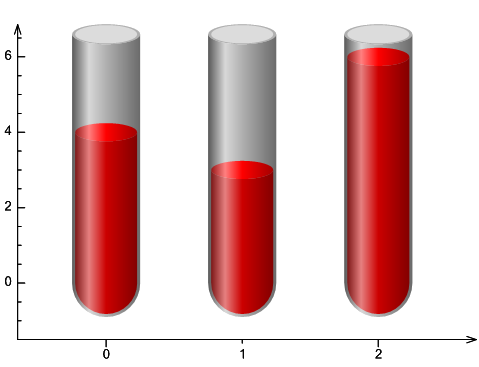
TankSeriesView представляет собой столбчатую диаграмму, в которой столбцы, соответствующие значениям из разных серий, располагаются рядом друг с другом и рисуются в форме колбы (Tank).
TankSeriesView is a bar chart which bars corresponding to different series values are located side by side and are drawn as Tank.
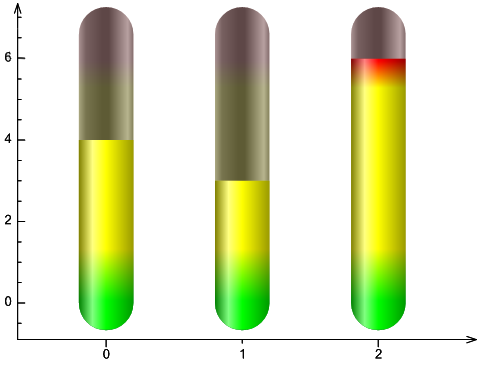
LevelSeriesView is a bar chart which bars corresponding to defferent series values are located side by side and are drawn as Levels. Upper and Lower layers are set with the help of the ActiveLayer and InactiveLayer properties.
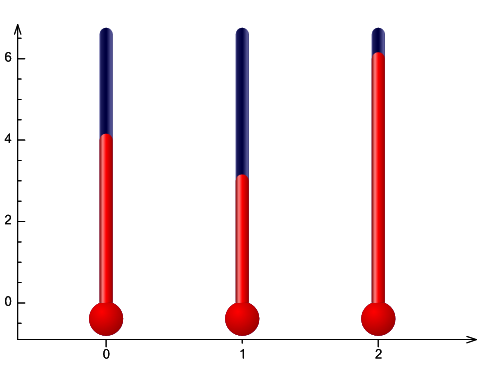
ThermometerSeriesView is a bar chart which bars corresponding to different series values are located side by side and are drawn as Thermometers. Upper and Lower layers are set in the ActiveLayer and InactiveLayer properties.
Bar charts allow assigning relative bar width (the AreaWidth property) and type of displayed elements (Bar, Cylinder, Bar3D, and Pyramide).